Solar Panel Cost in 2026: What I'd Tell You If You Were a Friend Asking
What solar panels actually cost in 2026, state by state — with the federal tax credit change explained. No inflated 'after-credit' pricing.
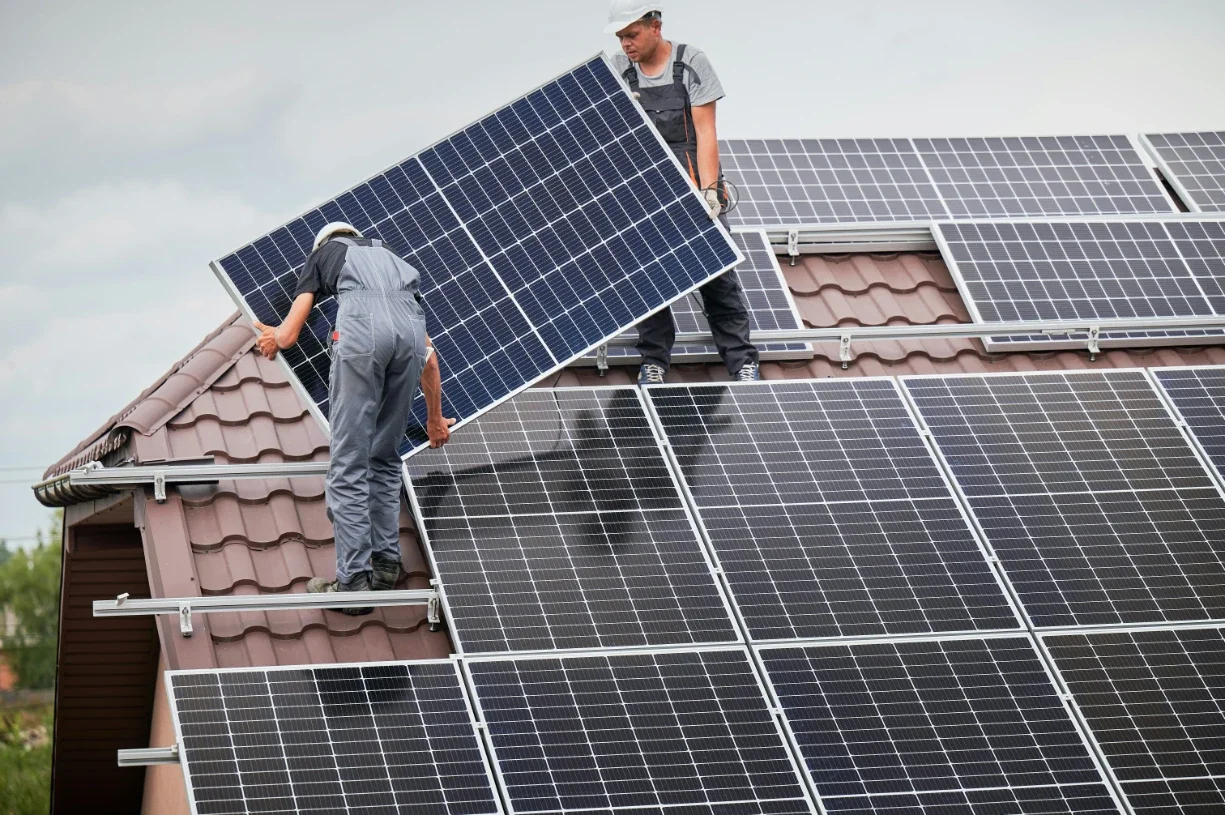
The solar industry has a transparency problem. Most websites quote a national average that doesn't reflect what you'll actually pay in your state, with your roof, on your timeline. And many still subtract a federal tax credit that no longer exists for cash and loan purchases.
Here's the real 2026 picture — gross prices, no imaginary discounts.
Ready to Explore Roles?
Want to Skip the Guesswork?
Everything below will get you close. A real quote from an installer who knows your roof and your state gets you exact.
Get Free Local Solar Quotes →Disclosure: that's an affiliate link. If you request a quote through it, I may earn a commission — costs you nothing extra. Full details on the disclosure page.
📖 What's in This Guide
- Why Nobody Can Just Give You a Straight Answer
- Okay, Fine — Here's the National Number
- What You're Actually Paying For
- The Tax Credit Thing Everyone's Getting Wrong
- Why Your Neighbor's Quote Isn't Yours
- What It Costs Where You Live
- The Costs That Show Up After You've Already Signed
- Cash, Loan, Lease, or PPA — Which One Actually Wins
- How to Not Get Taken for a Ride
- Is This Actually a Good Idea for You
- Questions I Get Asked Constantly
- Where That Leaves You
Why Nobody Can Just Give You a Straight Answer
Here's something that used to genuinely bother me before I started digging into this properly: ask ten different solar websites what panels cost, and you'll get ten different numbers, most of them presented with total confidence, and most of them not actually wrong so much as incomplete. Your price depends on your state, your roof, your electrical panel's condition, which installer shows up, and — this is the part that's changed and most sites haven't caught up on — whether the person writing the guide bothered to check what happened to the federal tax credit.
I want to be direct about that last piece because it's the reason I sat down to rewrite this whole guide rather than just tweak a few numbers. For most of the last decade, a 30% federal tax credit was just... baked into the conversation. Every calculator subtracted it automatically. Every salesperson quoted you the "after-credit" price like it was the real price. Then in July 2025, that changed for a huge chunk of buyers, and as of mid-2026, I'm still finding calculators and blog posts — some from sites I'd otherwise trust — quoting the old math like nothing happened.
So here's my actual promise for this guide: every number below is the real, gross, before-any-incentive price, clearly labeled, and I'll tell you exactly who still qualifies for what federal help and who doesn't. No quiet assumptions.
How Much Does Solar Cost in 2026?
A decent primer on where 2026 solar pricing actually stands — worth five minutes before you get your first quote.
TODO: Replace with actual image. Suggested: close-up of a solar quote/invoice with a calculator nearby. Caption: "Read the fine print on any 2026 quote like you're expecting it to be wrong — because a lot of them still are." Use Unsplash/Pexels search: "solar quote document calculator"
Okay, Fine — Here's the National Number
I'll give you the average, because you came here for a number and it'd be annoying to make you wait. Just don't treat it as a quote.
Across the sources I trust most — EnergySage's marketplace data, NREL's benchmark cost tracking, and a handful of independent 2026 cost analyses — residential solar in the U.S. runs $2.30 to $3.60 per watt before any incentives, with most homeowners landing closer to $2.75–$2.95 per watt as an average.
Translated into actual dollars, for the system sizes most people end up needing:
- Small system (4–6 kW): somewhere around $11,000 – $20,000
- Medium system (7–10 kW): $18,000 – $30,000 — this is where most homes land
- Large system (11–15 kW): $28,000 – $45,000
A typical American home needs roughly 8 to 12 kW to meaningfully dent its electric bill, which puts most people squarely in that $20,000–$31,000 gross range before touching any incentive.
For what it's worth, prices are still meaningfully better than they were ten years ago — NREL had the average around $3.16/watt back then — even with 2025's tariff pressure nudging things up a bit heading into 2026. It's not a straight line down, but the long trend is still in your favor.
And I'll say the quiet part again because it matters: "before incentives" means before incentives, full stop, no federal credit quietly subtracted. If a number you're seeing elsewhere looks suspiciously lower than what I've laid out, check whether it's assuming a lease or PPA, or whether the page you're reading was written before the rules changed and just never got updated.
What You're Actually Paying For
Fair question, and one I had myself early on: if panels keep getting cheaper every year, why hasn't the total price dropped just as fast? Because the panels themselves are a smaller slice of your bill than you'd think.
Here's roughly how a typical 2026 quote breaks down:
- Panels: ~12–30% of the total (sources disagree on the exact split, but it's consistently a minority share, not the majority — this genuinely surprises most people)
- Inverter: ~10%
- Mounting hardware and racking: ~15%
- Wiring, disconnects, monitoring gear (what installers call "balance of system"): usually a flat $1,500–$3,000
- Labor: ~15–25%
- Permits and utility interconnection: ~5–8%
- Everything else — design, sales, company overhead — often the single biggest line item, sometimes 30%+ of the whole quote
That last one is where I'd focus your attention if you only have energy to scrutinize one thing. I've seen — and this checks out across multiple independent quote reviews from 2026 — two installers quote the exact same panels, same inverter, same system size and come in $4,000 to $8,000 apart. Not because one installer found cheaper hardware. Because one runs leaner than the other. Which means getting multiple quotes isn't really about comparing solar panels. It's about comparing overhead, dressed up as a hardware comparison.
A few specific numbers worth having in your back pocket when a quote lands in your inbox:
- Labor usually runs $0.50–$0.75 per watt in a reasonably competitive market.
- Permits and inspections should total $500–$1,500 for a normal residential job. If you're staring at $2,000–$3,500+ in this line, ask them to itemize it — that's very often a soft-cost markup wearing a permit-fee costume.
- Balance-of-system components typically add $1,500–$3,000.
- A panel upgrade, if your home's electrical service is maxed out (very common in older homes with 100-amp service, or a 200-amp panel with no open breaker slots), runs $1,500–$4,500 — and this one's legitimate if your site visit actually turned it up, not a scare tactic.
Rough rule of thumb I use: if your cost-per-watt is under $2.60, ask pointed questions about equipment tier and how long the workmanship warranty actually is. If it's north of $3.80 and your roof isn't unusual, get a second opinion before you sign anything.
TODO: Replace with actual image. Suggested: photo showing solar system hardware components (inverter, mounting rails, wiring) laid out or installed — a real installer's work-in-progress shot reads well here. Caption: "This is the part nobody photographs for the brochure — and it's most of what you're actually paying for." Use Unsplash/Pexels search: "solar panel inverter wiring installation"
The Tax Credit Thing Everyone's Getting Wrong
Alright. This is the section I actually care most about getting right, because getting it wrong costs real money, not just an inconvenience.
What changed: for close to twenty years, in one form or another, the federal government let homeowners who bought or financed solar with cash or a loan claim 30% of the total installed cost back on their federal taxes. It was called the Residential Clean Energy Credit — Section 25D, if you want the exact tax code reference — and it was, without much competition, the single biggest financial lever in the entire industry.
In July 2025, Congress passed something called the "One Big Beautiful Bill Act." Buried in it: Section 25D got repealed for anything placed in service after December 31, 2025. Not phased down gradually the way earlier laws had scheduled it. Just gone, for anyone buying or financing a system with a loan.
What that actually means for you: if you're paying cash or financing through a standard solar loan or a HELOC in 2026, your federal tax credit is zero dollars. I want to say that plainly because a genuinely surprising number of calculators, and even a few salespeople who apparently haven't updated their pitch deck, are still quietly subtracting 30% like nothing happened. If you see a quote showing an "after-credit" price and you're buying or financing with a loan, that number is describing a world that ended on December 31, 2025.
Here's the one door that's still open: there's a separate credit — Section 48E — aimed at businesses, and it's still fully active. If a company owns the solar equipment on your roof and leases it back to you (a solar lease) or sells you the power it produces (a PPA — power purchase agreement), that company can claim the 30% credit on equipment it owns, and depending on how competitive the market is, some of that value might make its way back to you as a lower monthly rate. You never see the credit directly. You just might see its shadow in your price.
Which creates a slightly odd situation that didn't used to exist: buying — which has always been, and honestly still is, the stronger financial move for most people — now gets zero federal help. Leasing, historically the weaker choice long-term, is currently the only way to have any federal credit touch your project at all.
I don't think that flips my overall advice. Buying still tends to save you meaningfully more over 15-25 years, mostly because you dodge the lease's annual payment escalator (typically climbing 2.9%–3.9% every single year) and you keep every dollar of your own electricity savings instead of splitting that value with a leasing company. But the gap is genuinely narrower than it used to be, and I'd actually run both numbers for your specific situation rather than assume buying wins by the same wide margin it did back in 2024.
One more thing worth knowing: state and local incentives didn't go anywhere. California's SGIP battery rebate, Massachusetts' SMART program, New York's Megawatt Block incentive, various state tax credits and property tax exemptions — all of that keeps running independent of what happened federally, and in some states it meaningfully softens the loss of the federal credit. More on that in the state-by-state breakdown below.
TODO: Replace with actual image. Suggested: build as an SVG/CSS comparison graphic instead of a photo — "Before Dec 31, 2025 vs. 2026 Onward" comparison. For now, placeholder.
If you buy a solar system in 2026, you can no longer claim the 30% federal residential tax credit — it expired on December 31, 2025 and did not step down. — industry cost analysis, 2026
Is Solar Still Worth It in 2026? Honest Truth
Straight answer on whether solar still pencils out now that the purchase credit is gone — no sugarcoating.
Why Your Neighbor's Quote Isn't Yours
If you've ever compared notes with a friend in a different state and gotten wildly different numbers for what looked like the same system, here's what's actually driving that — and it has almost nothing to do with how sunny either of your states are.
Labor. States with prevailing wage rules, strong trade unions, or just a higher general cost of living pay their solar crews more, and that shows up directly in your quote. This alone explains a huge chunk of why a system in Massachusetts can run 30%+ more than the exact same system in Arizona.
Permitting. Some cities and states have adopted automated permitting software — SolarAPP+ is the big one — that can turn a multi-week permit review into a same-day approval. Others still run everything through manual review, adding a month or more to your timeline. Every extra week an installer's team spends babysitting your permit is a week they're not installing someone else's system, and that opportunity cost quietly folds into their pricing.
Competition. Markets with a lot of installers fighting for your business — California, Texas, Florida, Arizona — tend to have noticeably lower prices, purely because competition squeezes margins. Thin markets, especially rural areas or states where solar adoption is still young, tend to have the highest per-watt prices, even in places that get plenty of sun.
Sunlight hours matter enormously for how much energy your system actually produces — which determines how big a system you need — but they barely move your cost per watt. I've seen cloudy states with strong installer competition beat sunny states with a thin, uncompetitive market on straight per-watt pricing. Don't assume "sunnier" means "cheaper."
What It Costs Where You Live
Based on 2026 marketplace data and a few independent cost-tracking analyses I trust, states roughly sort into three tiers:
The Cheap Seats: $2.20 – $2.60/watt
Arizona, Texas, Nevada, New Mexico, Florida — Lots of installers competing for your business, and that competition does more for your price than the abundant sunshine does. A 7 kW system typically lands around $15,400 – $18,200 gross.
The Middle Ground: $2.60 – $2.90/watt
California, Colorado, North Carolina, Pennsylvania, New Jersey, Virginia — Labor costs a bit more here, but a genuinely competitive installer market keeps it from getting out of hand. A 7 kW system runs roughly $18,200 – $20,300 gross.
The Expensive End: $2.90 – $3.60/watt
Massachusetts, Connecticut, New York, Rhode Island, Vermont, Nebraska, South Dakota — Higher labor, thornier permitting, or just fewer installers to choose from. A 7 kW system here can hit $20,300 – $25,200 gross.
Here's the part I find genuinely interesting, though: some of the most expensive states to install in actually pay back the fastest, because they also charge some of the highest electricity rates in the country. New Jersey — sitting in the middle tier — pencils out to roughly a 6.4-year payback at $2.81/watt. Vermont, at almost the identical $2.80/watt, stretches out to 12.8 years. Nearly the same sticker price, wildly different return, purely because of what each state charges for grid electricity and how generous its net metering rules are. Cost per watt tells you what you'll write the check for. It tells you almost nothing about how fast you'll get that money back.
| Region | Cost per Watt (2026) | 7 kW System (Gross) | Why |
|---|---|---|---|
| Southwest (AZ, NM, NV) | $2.40–$2.70 | ~$16,100–$18,900 | Great sun, but competition is the real driver |
| Southeast (FL, GA, NC) | $2.40–$2.80 | ~$16,800–$19,600 | Competitive market, solid sun |
| California | $2.60–$3.00 | ~$18,200–$21,000 | Labor's pricier, competition keeps it in check |
| Midwest (IL, OH, MI) | $2.70–$3.10 | ~$18,900–$21,700 | Fewer installers, shorter solar season |
| Northeast (NY, MA, CT) | $2.80–$3.20 | ~$19,600–$22,400 | Labor and permitting both push prices up |
| High-cost outliers (VT, NE, SD) | up to $3.60 | ~$20,300–$25,200 | Thin installer market, plain and simple |
Gross, pre-incentive estimates based on 2026 marketplace and industry cost data. These are ranges to sanity-check a quote against — not a substitute for getting one.
The Costs That Show Up After You've Already Signed
Most quoted prices cover the core system — panels, inverter, standard mounting, standard labor. What they often don't mention out loud, until you're already invested in the process, are a handful of legitimate but easy-to-miss add-ons:
- Panel upgrade: $1,500 – $4,500, if your home's electrical service is maxed out — extremely common in older homes with 100-amp service or a nearly-full 200-amp panel
- Roof work: varies a lot, but if your roof needs attention, doing it before the panels go up is dramatically cheaper than paying to pull the whole array down and reinstall it later
- Tree trimming or removal: $200 – $800+, worth it if shade is genuinely cutting into your production
- Roof complexity: steep pitches, multiple roof planes, tile or metal roofing — all of these can push labor costs up 25-50% over a straightforward single-plane asphalt roof
- HOA requirements: some HOAs demand specific mounting configurations or visual screening that add cost you won't see in a generic online estimate
- Insurance: adding solar can nudge your homeowner's premium up slightly, and some insurers want a rider to fully cover the equipment
None of this is a scam when it's disclosed upfront and tied to something real about your specific house. It becomes a problem when it surfaces after the contract's signed, which is really just an argument for insisting on an actual in-person site visit rather than settling for a satellite-photo estimate.
TODO: Replace with actual image. Suggested: photo of an installer physically inspecting a roof or electrical panel. Caption: "This is the visit that catches the surprise costs — before they become surprise costs." Use Unsplash/Pexels search: "electrician inspecting roof solar" or "electrical panel breaker box"
Cash, Loan, Lease, or PPA — Which One Actually Wins
How you pay for this matters more this year than it used to, because your payment method now decides whether you get any federal help at all.
Cash
Still the strongest play, financially. You own the system from day one, keep every cent of your electricity savings and net metering credit, and add resale value to your home. You get $0 federal credit in 2026 — but you also skip every financing cost entirely, which counts for something.
Solar loan
You own the system, so still $0 federal credit, but now you're also paying interest — solar-specific loans can tack on 20-35% to your total cost over the life of the loan, and that number has a habit of hiding behind a friendly-sounding monthly payment pitch. If financing is genuinely necessary, a home equity loan or HELOC almost always beats a solar-specific loan on terms, because it's secured against your home rather than priced like a specialty consumer product.
Lease
You don't own anything — the leasing company does, and they're the one claiming that 30% Section 48E credit, maybe passing some of it back to you as a lower rate. What they don't advertise as loudly: an annual payment escalator, typically 2.9%-3.9% a year, so your "fixed" bill quietly climbs every single year. Leases also make selling your home more annoying, since a buyer has to qualify to take over your lease.
PPA
Same basic ownership setup as a lease — someone else owns the panels and claims the credit — but instead of a flat monthly fee, you pay for the actual electricity the system produces, usually below what your utility charges. I find this the fairer of the two lease-style options, since a genuinely cloudy year costs you less rather than charging you the same fixed rate regardless of output.
My actual take
If you can swing cash or a reasonably priced HELOC, buying is still going to save you more over 15-25 years, even without the tax credit. If that's genuinely not on the table — or your tax situation means a credit wouldn't have helped you much anyway — a PPA beats a straight lease, because at least your payment tracks what the system's actually doing rather than a fixed number that climbs regardless.
How to Not Get Taken for a Ride
A short, practical checklist before you sign anything:
- Ask directly: is this price gross, or "after incentive"? If it's after-incentive and you're paying cash or financing with a loan, ask exactly which incentive they mean and get the answer in writing. This is genuinely the single most common place a 2026 quote goes wrong.
- Does the quote separate equipment costs from soft costs, or bundle everything into one number? A bundled number makes it nearly impossible to tell whether you're paying for a legitimate site condition or just a fatter margin.
- Does the cost-per-watt match your state's tier? (See the table above.) Way under it, ask about equipment and warranty length. Way over it with nothing unusual about your roof, get a second opinion.
- Who backs the warranty, and for how long? Equipment warranties usually come from the manufacturer and are fairly standard. Workmanship warranties come from the installer — worth asking how financially stable that company actually is, since a workmanship warranty from a company that folds in three years isn't worth much.
- Get at least three quotes for a genuinely comparable system. Since soft costs — not hardware — explain most of the spread between quotes, multiple quotes are your best tool for spotting whether a number is fair or just confident.
Is This Actually a Good Idea for You
✅ This tends to work out well if you...
- Live somewhere with genuinely high electricity rates
- Plan on staying put for at least 7-10 years
- Have a mostly unshaded, south-facing roof
- Can pay cash, or get a HELOC instead of a high-interest solar loan
- Live somewhere with genuinely favorable net metering rules
⚠️ Slow down and think if you...
- Have a heavily shaded roof, or one facing north
- Might move within the next 3-5 years
- Live somewhere with low electricity rates and no net metering
- Would need a high-interest solar loan
- Have a roof that needs replacing soon
Questions I Get Asked Constantly
Is there still a federal tax credit for solar panels in 2026?
Not if you're buying or financing with a loan. The 30% credit (Section 25D) expired December 31, 2025. The only remaining path to a 30% federal credit is through a solar lease or PPA, where the leasing company claims a separate credit and may pass some value back through your rate.
How much do solar panels actually cost in 2026, no incentives?
Gross, before anything: $2.30 to $3.60 per watt nationally, with most homeowners paying somewhere between $18,000 and $31,000 for a typical 7-10 kW system.
Why does my quote look so different from a friend's in another state?
Almost entirely labor costs, permitting speed, and how many installers are competing for business in your area — not how much sun either of you gets.
Should I buy or lease solar in 2026?
Buying still tends to win over the long run for most people, since you keep all your savings and dodge the lease's rising payments — even though buying no longer gets a federal credit. Leasing/PPA is currently your only door into that credit, which narrows the gap but usually doesn't flip the answer.
What's actually in a standard solar quote, and what's usually left out?
Included: panels, inverter, mounting, wiring, standard labor, permits. Often left out until later: electrical panel upgrades, roof repairs, tree trimming, HOA-specific requirements. Ask about all four upfront.
How do I tell if a quote is actually fair?
Check the cost-per-watt against your state's typical range, ask for an itemized (not bundled) breakdown, and get two or three more quotes for a comparable system before deciding anything.
Do state solar incentives still exist after the federal credit ended?
Yes, completely unaffected. State tax credits, property tax exemptions, utility rebates, programs like California's SGIP or Massachusetts' SMART — none of that changed.
How long until solar actually pays for itself in 2026?
Typically 6-10 years, though it swings a lot by state — sometimes a pricier state to install in still pays back faster, because of what it charges for electricity.
Is it a bad time to go solar since the tax credit's gone?
Not automatically. Equipment costs are still historically low, and state incentives plus straightforward electricity savings still make the math work for a lot of homeowners — it's just a different calculation than it was in 2025, worth actually running for your own numbers instead of assuming either "still amazing" or "not worth it anymore."
Where That Leaves You
If I had to boil this whole guide down to one habit worth adopting: never trust a solar number until you know what it's assuming. "It costs $18,000" and "it costs $18,000 after a tax credit that doesn't apply to you" are two completely different sentences, and the gap between them is exactly the kind of thing that makes people feel burned after they've already signed.
Get the real, gross number first. Figure out honestly which financing path, if any, actually gets you federal help. Get more than one quote for the same system. Then decide if the math works for your roof, your electricity rate, and how long you're planning to stay put.
That's genuinely it. Everything else is detail.
Get Actual Numbers for Your House
See what installers in your state would really charge you — no pressure, no obligation.
Compare Local Solar Quotes →More from the blog
This post contains affiliate links. If you click through and take action, I may earn a commission at no cost to you. Full details on the Affiliate Disclosure page.